If you have ever needed to hierarchical extract data from an 8i system to put in a data integrator template for import into a TRIRIGA 9 system, you probably know about the challenge of pulling the parent path. The following SQL statement can be used to extract this data (this example is for Space Class Current):
select a.spec_id, a.sys_parent1, a.classname,
(select b.fullpath from tridata.t_spaceclasscurrent b where b.spec_id = a.sys_parent1) "PARENTPATH"
from tridata.t_spaceclasscurrent a
order by a.fullpath
Tuesday, December 9, 2008

Thursday, November 6, 2008
Business Connect
If you are using Business Connect for integration development and would would like a tool that can log into your application server, show all of the available methods and allow you to manually execute them, you may want to consider SoapSonar by Crosscheck Networks (http://www.crosschecknet.com/download/download.php). They offer both an enterprise edition (with a free trial) and a free personal edition that will provide access to the Business Connect WSDL Methods.
To use the product, enter your WSDL location (i.e., http://yourServerName:8001/ws/TririgaWS?wsdl) and click on the Capture WSDL button. You will see a screen that looks like this:
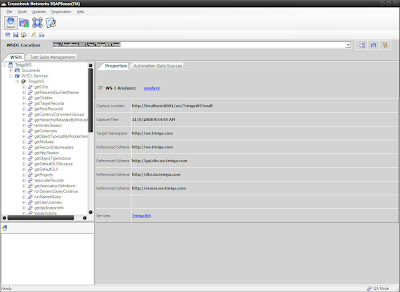
To execute a method use the tree on the left to drill into it. Once the method is selected look at the schema fields on the request, enter any required data (depending on the method you are calling), set the authentication to use your API user, and click execute.
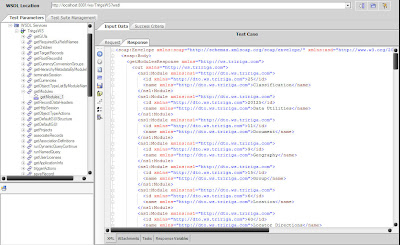
In the example below, I executed getModules which has no required input. The screen show shows the response from the server.
To use the product, enter your WSDL location (i.e., http://yourServerName:8001/ws/TririgaWS?wsdl) and click on the Capture WSDL button. You will see a screen that looks like this:

To execute a method use the tree on the left to drill into it. Once the method is selected look at the schema fields on the request, enter any required data (depending on the method you are calling), set the authentication to use your API user, and click execute.
In the example below, I executed getModules which has no required input. The screen show shows the response from the server.

Monday, September 8, 2008
Add a Documents Tab to a Custom Object
Adding a Documents tab to a custom object is a very simple process. Here’s what you do:
• In the Data Modeler, create an association between your object and the Document module, Document object using an association string of Has Document with a reverse string of Is Document For
• Revise and republish the business object
• Open the GUI Builder and add a xxDocuments tab
• Under your new tab create a query section called xxRelatedDocuments using Document - Display - Associated to Current Record as the query, setting the Association Type to Has Document
• Re-label the DeAssociate action to Remove
• Add a new action called Upload, check the Pop Up box, set the Action Type to Custom and enter this URL: /html/en/default/docmgmt/objectupload/objectFrameSet.jsp?folderId=-1&showFolders=true&multiFile=true
• Publish your GUI
• In the Data Modeler, create an association between your object and the Document module, Document object using an association string of Has Document with a reverse string of Is Document For
• Revise and republish the business object
• Open the GUI Builder and add a xxDocuments tab
• Under your new tab create a query section called xxRelatedDocuments using Document - Display - Associated to Current Record as the query, setting the Association Type to Has Document
• Re-label the DeAssociate action to Remove
• Add a new action called Upload, check the Pop Up box, set the Action Type to Custom and enter this URL: /html/en/default/docmgmt/objectupload/objectFrameSet.jsp?folderId=-1&showFolders=true&multiFile=true
• Publish your GUI
Creating a System tab on a Custom Object
The information contained on the out-of-box System tab can be very useful for administrators and power users. Here is how to extend a System tab to a custom object:
Add the following fields to your business object using Find:
I also like to include spec_id which is:
triRecordIdSY
For the Modified By field to work, you will have to perform a few additional steps:
Publish the Business Object then open the GUI builder. Create a new tab called xxSystem and a new section under that tab called xxRecordInformation. Add the above fields to the layout as shown below and Publish the GUI.
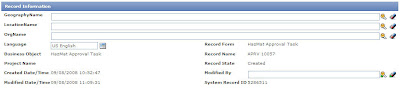
If you are using triModifiedByTX, don’t forget to include a locator query on the Modified By field.
Add the following fields to your business object using Find:
- triLanguageLI
- triFormLabelSY
- triBusinessObjectLabelSY
- triRecordNameSY
- triProjectNameSY
- triRecordStateSY
- triCreatedSY
- triModifiedByTX
- triModifiedSY
I also like to include spec_id which is:
triRecordIdSY
For the Modified By field to work, you will have to perform a few additional steps:
- Create a new association to the triPeople module, triPeople business object with an association string of Auto Recorded By and a reverse association of Auto Recorded.
- Set the triModifiedByTX field to be a locator field. Locate using triPeople, Auto Recorded By and map to triNameTX
- If your object has a sub action that calls xxBusinessObjectName - Synchronous - Permanent Save Validation, it will call the xxBusinessObjectName - Synchronous - Module level business rules workflow which will update the Modified By field. If not, you will need to write workflows to update this field on any given state transition
Publish the Business Object then open the GUI builder. Create a new tab called xxSystem and a new section under that tab called xxRecordInformation. Add the above fields to the layout as shown below and Publish the GUI.

If you are using triModifiedByTX, don’t forget to include a locator query on the Modified By field.
Tuesday, August 12, 2008
How to view long-running SQL Processes with Oracle 10g Enterprise Manager
To see the log running queries:
- Open the Oracle Enterprise Manager 10g Web-interface (typically found at http://DBServer:1158/em/console)
- Click on the Performance Tab
- At the bottom of the page, there is a Top Activity link
- In that page, there will be a Top SQL link. If you click on the SQL ID, it will bring up the statement that was executed.
- If it is a select, there will be a Plan tab, it will show how expensive the statement is.
- If it looks like a TRIRIGA query, either coming from a manager, portal, or GUI query section, the query should be refactored and/or redesigned to allow for better performance.
- The report can normally be easily identified by the tables or Module-views it selects from, so for example, if the statement is question looks like:
SELECT ROW1, ROW2, ROW3
FROM T_TRIBUSINESSOBJECT
WHERE ROW1 like ':1'
- Look in the report manager for a report/query/graph, etc, that is looking at the TRIBusinessObject BO.
- Test different reports by opening the report, and clicking the "Export SQL" link. The sql can be verified against what Oracle is reporting back
Gathering Database Statistics
In order to improve performance TRIRIGA recommends gathering database statistics on a daily basis. Normally this is done as part of the daily cleanup jobs. If you notice poor system performance on a day with particularly heavy usage or during a data load you can manually gather statistics by running the following scripts.
EXECUTE DBMS_STATS.GATHER_SCHEMA_STATS('TRIDATA',DBMS_STATS.AUTO_SAMPLE_SIZE);
If 2.1.9.X is being used, also run:
EXECUTE DBMS_STATS.GATHER_SCHEMA_STATS('TRIRIGA',DBMS_STATS.AUTO_SAMPLE_SIZE);
EXECUTE DBMS_STATS.GATHER_SCHEMA_STATS('TRIDATA',DBMS_STATS.AUTO_SAMPLE_SIZE);
If 2.1.9.X is being used, also run:
EXECUTE DBMS_STATS.GATHER_SCHEMA_STATS('TRIRIGA',DBMS_STATS.AUTO_SAMPLE_SIZE);
Thursday, July 10, 2008
Capturing Traffic Between the App and Database Servers
In order to troubleshoot issues you are having you may want to capture the network traffic between your application and database servers. This will allow you to see SQL statements being passed to the database, along with a lot of other potentially useful information. The basic procedure is outlined below (thanks to Eric Glass):
1) Stop the application server.
Note that technically, you don't have to establish the SSH tunnel directly to the application server; any SSH server will work (i.e. a Unix box completely unrelated to the application system). You would need to ensure the source end of the tunnel on the SSH server accepts connections from other hosts (typically an option in the tunnel configuration settings); you would then point the application server to that box instead of 127.0.0.1.
Once you have the capture, there are a variety of tools Wireshark provides to analyze the capture. For example, select Statistics -> Conversations from the Wireshark menu and click the "TCP" tab; this will show all TCP connections active during the capture period. You can start examining these by selecting an entry from the list, right clicking, and selecting "Apply as Filter -> Selected -> A<->B" from the popup menu. This will filter the packet window to display only that connection. You can also view or save all the traffic for a connection as text by selecting a packet in the list and choosing "Follow TCP Stream". For many protocols, Wireshark includes dissectors which will parse out the traffic and present it semantically (for example, it can decode HTTP traffic and display request/response information). I don't believe there is currently a dissector for Oracle, but you can view the raw TCP streams to see the SQL statements going over the wire
Here are some general instructions for capturing traffic sent from the application server to the database server:
1) Stop the application server.
2) Set up a remote SSH tunnel on any free port on the application server (e.g., 9999), pointing to the database host/port. The exact terminology used for this varies by SSH client, but typically it would be:
Source Port: 9999
Destination Host: database server
Destination Port: database port (typically 1521 for Oracle, 1433 for SQL server)
Destination Host: database server
Destination Port: database port (typically 1521 for Oracle, 1433 for SQL server)
For Putty, the required settings can be found in the connection configuration dialog under SSH -> Tunnels (source port would be "9999", destination would be of the form "host:port", e.g. "mydbserver:1521"). For OpenSSH, the command line parameter would be "-R 9999:mydbserver:1521".
3) Make the SSH connection. You will need to leave the shell window open for the duration for the tunnel to remain open.
4) Start Wireshark. Go to Capture -> Interfaces; click "Options" for the interface you want to capture. In the Capture Options dialog, enter the following in the Capture Filter:
host mydbserver && port 1521
(substituting the appropriate database server host/port). Ensure "Update list of packets in real time" is checked. Click "Start" to start capturing.
5) Test the tunnel; make another SSH connection to the application server, and type:
telnet localhost 9999
This will open a connection to the remote end of the tunnel; traffic will be routed over the SSH connection, and an outgoing connection will be made from your client box to the database server on the destination port. You should see the outgoing connection traffic in Wireshark. Close the second SSH window and restart capturing in Wireshark (Capture -> Restart from the menu). Alternatively, you can revise the capture filter at this point to also include web traffic from the browser to the application server:
(host mydbserver && port 1521) || (host appserver && port 80)
6) Modify the application server JDBC configuration to point to port 9999 on 127.0.0.1. The application server will be connecting to the tunnel source port locally, which will spawn an outgoing connection from your client box to the database server (which will be captured).
7) Restart the application server and verify that traffic is received in Wireshark.
8) Restart capturing in Wireshark, perform the desired operation in the application, then stop capturing in Wireshark. This will ensure you get a concise capture with minimal "noise" from other application activity.
9) Save the capture file, and reset your configuration to normal.
Note that technically, you don't have to establish the SSH tunnel directly to the application server; any SSH server will work (i.e. a Unix box completely unrelated to the application system). You would need to ensure the source end of the tunnel on the SSH server accepts connections from other hosts (typically an option in the tunnel configuration settings); you would then point the application server to that box instead of 127.0.0.1.
Once you have the capture, there are a variety of tools Wireshark provides to analyze the capture. For example, select Statistics -> Conversations from the Wireshark menu and click the "TCP" tab; this will show all TCP connections active during the capture period. You can start examining these by selecting an entry from the list, right clicking, and selecting "Apply as Filter -> Selected -> A<->B" from the popup menu. This will filter the packet window to display only that connection. You can also view or save all the traffic for a connection as text by selecting a packet in the list and choosing "Follow TCP Stream". For many protocols, Wireshark includes dissectors which will parse out the traffic and present it semantically (for example, it can decode HTTP traffic and display request/response information). I don't believe there is currently a dissector for Oracle, but you can view the raw TCP streams to see the SQL statements going over the wire
Subscribe to:
Posts (Atom)