If you find your app server running out of Java heap space, or just want to monitor it to look for issues, running the Java Monitoring and Management console is a relatively easy method to accomplish this. To set this up, you will need to add the following to the startup properties for the JVM, typically the run.bat (or run.sh) file:
-Dcom.sun.management.jmxremote.port=6778
-Dcom.sun.management.jmxremote.authenticate=false
-Dcom.sun.management.jmxremote.ssl=false
This starts the JVM with a monitoring server on port 6778 (you can pick any port you want, just change the number above). Then, from your desktop (you must have the JDK 1.5+ installed, not just the JVM) you would run the following at a command prompt:
java -jar jconsole.jar appserver:6778
Where "appserver" is the hostname or IP address of the app server. If jconsole isn't in your path, you should be able to find it in the "bin" directory under your JDK installation. That should pop up a handy console window where you can monitor various statistics on the server. One thing to watch for is "PS Old Gen" completely filling up, as this will make your TRIRIGA server non-responsive.
If you don't have the JDK installed (but have a JVM) you can still access the JConsole by just downloading the jconsole.jar file to your local system and running the above command from the same directory.
Thanks to Eric Glass for this tip!
Thursday, August 13, 2009

Wednesday, June 17, 2009
Using Google Charts in TRIRIGA
A customer asked a coworker of mine to embed some dashboard-style graphs on his portal to look something like this: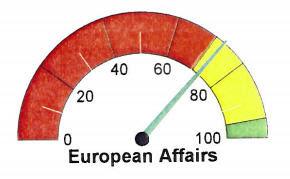
You can do pretty much exactly that with the Google Charts API; here is an example:

http://chart.apis.google.com/chart?chs=225x125&cht=gom&chtt=European%20Affairs&chl=72&chd=t:72
This will render a PNG image with the following parameters:
chs: chart size, e.g. 225x125
cht: chart type, here "gom" = Google-O-Meter
chtt: chart title
chl: label at end of arrow, here I just used the data value
chd: chart data, here "t:72" gives a value of 72
You can embed this in an HTML document by doing something like:
More information is here:
http://code.google.com/apis/chart/basics.html
Many thanks to Eric Glass for this cool solution!

You can do pretty much exactly that with the Google Charts API; here is an example:
chs: chart size, e.g. 225x125
cht: chart type, here "gom" = Google-O-Meter
chtt: chart title
chl: label at end of arrow, here I just used the data value
chd: chart data, here "t:72" gives a value of 72
You can embed this in an HTML document by doing something like:
<img src="http://chart.apis.google.com/chart?chs=225x125&cht=gom&chtt=European%20Affairs&chl=72&chd=t:72"/>
More information is here:
http://code.google.com/apis/chart/basics.html
Many thanks to Eric Glass for this cool solution!
Monday, June 15, 2009
Concurrent License Usage
As part of an effort to monitor maximum concurrent license usage, a colleague of mine wrote a SQL script to query ACTIVE_SESSION_USER joined to T_LICENCEDETAILS. He then created a batch script to run the the SQL script with SQLplus and another batch script to concatenate the results. The results were dumped to a .csv file every five minutes. Once the sample data had been gathered, he pulled it into Excel for analysis and created this nifty chart:
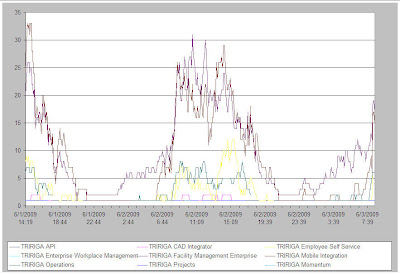
The SQL used to gather the data behind the chart is:
column dcol new_value mydate noprint
select to_char(sysdate,'YYYYMMDDHH24MISS') dcol from dual;
set echo off
set feedback off
set linesize 100
set pagesize 0
set sqlprompt ''
set trimspool on
spool c:\temp\concurrency\&mydate._output.csv
select to_char(sysdate, 'MM/DD/YYYY HH24:MI:SS')||','||b.username||','||b.peoplefullname||','||c.userlicence
from tridata9.active_session_user a, tridata9.t_myprofile b, tridata9.ibs_spec_assignments isa, tridata9.t_licencedetails c
where a.user_id = b.spec_id
and b.spec_id = isa.spec_id
and isa.ass_spec_id = c.spec_id;
spool off
exit
Thanks Chris for your contribution!

The SQL used to gather the data behind the chart is:
column dcol new_value mydate noprint
select to_char(sysdate,'YYYYMMDDHH24MISS') dcol from dual;
set echo off
set feedback off
set linesize 100
set pagesize 0
set sqlprompt ''
set trimspool on
spool c:\temp\concurrency\&mydate._output.csv
select to_char(sysdate, 'MM/DD/YYYY HH24:MI:SS')||','||b.username||','||b.peoplefullname||','||c.userlicence
from tridata9.active_session_user a, tridata9.t_myprofile b, tridata9.ibs_spec_assignments isa, tridata9.t_licencedetails c
where a.user_id = b.spec_id
and b.spec_id = isa.spec_id
and isa.ass_spec_id = c.spec_id;
spool off
exit
Thanks Chris for your contribution!
Tuesday, April 21, 2009
Workflow Instance Settings
With the 2.6 platform there are now four possible settings for saving workflow instance data. You can always save instance data, never save it, or save it based on the "Save Workflow Instances" setting in each individual workflow either always or only when running in production mode. The choice is dictated by the value of WF_INSTANCE_SAVE tririgaweb.properties file. The options are:
- ALWAYS - always save all instance data
- NEVER - never save any instance data
- PER_WORKFLOW_ALWAYS - save instance based on the workflow "Save Workflow Instance" setting in each individual workflow
- PER_WORKFLOW_PRODUCTION - save instance based on the workflow "Save Workflow Instance" setting in each individual workflow only when in production mode. If ProductionMode = N then workflow instances will always be saved
Wednesday, April 15, 2009
Form Reports with Multi-Line Smart Sections
I found some odd behavior when creating a form report displaying multi-line smart section rows. I created the table but only the first cell of each row was getting populated with data, none of the additional columns displayed any data.
Here is an example of the html code I used in the table:
<tbody>
<tr>
<td>Work Task ID</td>
<td>Task Name</td>
</tr>
<tr>
<td>%%triWorkTasks_triIdTX%%</td>
<td>%%triWorkTasks_triNameTX%%</td>
</tr>
</tbody>
The workaround is to add a space after the for each cell containing the %% tags, so it looks like this: . After doing that the data displayed as expected.
Here is the fixed version of my example:
<tbody>
<tr>
<td>Work Task ID</td>
<td>Task Name</td>
</tr>
<tr>
<td >%%triWorkTasks_triIdTX%%</td>
<td >%%triWorkTasks_triNameTX%%</td>
</tr>
</tbody>
Here is an example of the html code I used in the table:
<tbody>
<tr>
<td>Work Task ID</td>
<td>Task Name</td>
</tr>
<tr>
<td>%%triWorkTasks_triIdTX%%</td>
<td>%%triWorkTasks_triNameTX%%</td>
</tr>
</tbody>
The workaround is to add a space after the for each cell containing the %% tags, so it looks like this: . After doing that the data displayed as expected.
Here is the fixed version of my example:
<tbody>
<tr>
<td>Work Task ID</td>
<td>Task Name</td>
</tr>
<tr>
<td >%%triWorkTasks_triIdTX%%</td>
<td >%%triWorkTasks_triNameTX%%</td>
</tr>
</tbody>
Tuesday, December 9, 2008
Finding the Parent Path
If you have ever needed to hierarchical extract data from an 8i system to put in a data integrator template for import into a TRIRIGA 9 system, you probably know about the challenge of pulling the parent path. The following SQL statement can be used to extract this data (this example is for Space Class Current):
select a.spec_id, a.sys_parent1, a.classname,
(select b.fullpath from tridata.t_spaceclasscurrent b where b.spec_id = a.sys_parent1) "PARENTPATH"
from tridata.t_spaceclasscurrent a
order by a.fullpath
select a.spec_id, a.sys_parent1, a.classname,
(select b.fullpath from tridata.t_spaceclasscurrent b where b.spec_id = a.sys_parent1) "PARENTPATH"
from tridata.t_spaceclasscurrent a
order by a.fullpath
Thursday, November 6, 2008
Business Connect
If you are using Business Connect for integration development and would would like a tool that can log into your application server, show all of the available methods and allow you to manually execute them, you may want to consider SoapSonar by Crosscheck Networks (http://www.crosschecknet.com/download/download.php). They offer both an enterprise edition (with a free trial) and a free personal edition that will provide access to the Business Connect WSDL Methods.
To use the product, enter your WSDL location (i.e., http://yourServerName:8001/ws/TririgaWS?wsdl) and click on the Capture WSDL button. You will see a screen that looks like this:
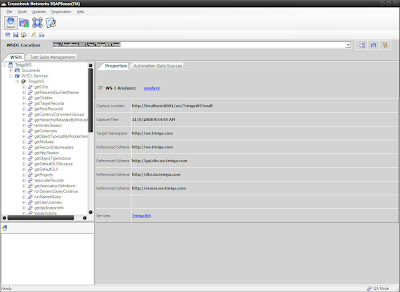
To execute a method use the tree on the left to drill into it. Once the method is selected look at the schema fields on the request, enter any required data (depending on the method you are calling), set the authentication to use your API user, and click execute.
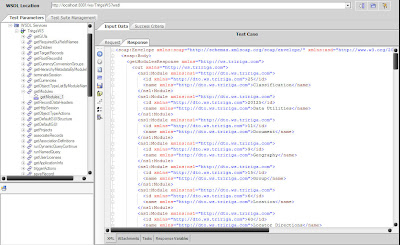
In the example below, I executed getModules which has no required input. The screen show shows the response from the server.
To use the product, enter your WSDL location (i.e., http://yourServerName:8001/ws/TririgaWS?wsdl) and click on the Capture WSDL button. You will see a screen that looks like this:

To execute a method use the tree on the left to drill into it. Once the method is selected look at the schema fields on the request, enter any required data (depending on the method you are calling), set the authentication to use your API user, and click execute.
In the example below, I executed getModules which has no required input. The screen show shows the response from the server.

Subscribe to:
Posts (Atom)