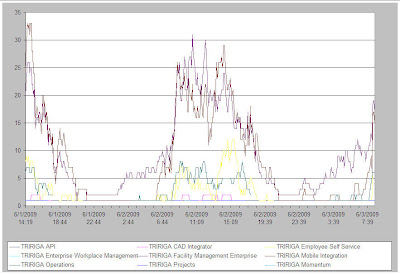
The SQL used to gather the data behind the chart is:
column dcol new_value mydate noprint
select to_char(sysdate,'YYYYMMDDHH24MISS') dcol from dual;
set echo off
set feedback off
set linesize 100
set pagesize 0
set sqlprompt ''
set trimspool on
spool c:\temp\concurrency\&mydate._output.csv
select to_char(sysdate, 'MM/DD/YYYY HH24:MI:SS')||','||b.username||','||b.peoplefullname||','||c.userlicence
from tridata9.active_session_user a, tridata9.t_myprofile b, tridata9.ibs_spec_assignments isa, tridata9.t_licencedetails c
where a.user_id = b.spec_id
and b.spec_id = isa.spec_id
and isa.ass_spec_id = c.spec_id;
spool off
exit
Thanks Chris for your contribution!
3 comments:
Did you have to perform some other data manipulation to get the data to work?
I can check with my coworker who wrote this.
To concatenate the data into one file:
copy *_output.csv output.csv
Then I took the data and used a pivot table to get count of user ID by date/time and license.
Post a Comment